
Journal · Transportation
EVs: Who Will Supply Asia, Europe and America?
China leads EV production, Europe electrifies faster than North America, and the next competitive advantage connects vehicles, charging, software and service. A regional outlook and manufacturer watchlist through 2030.
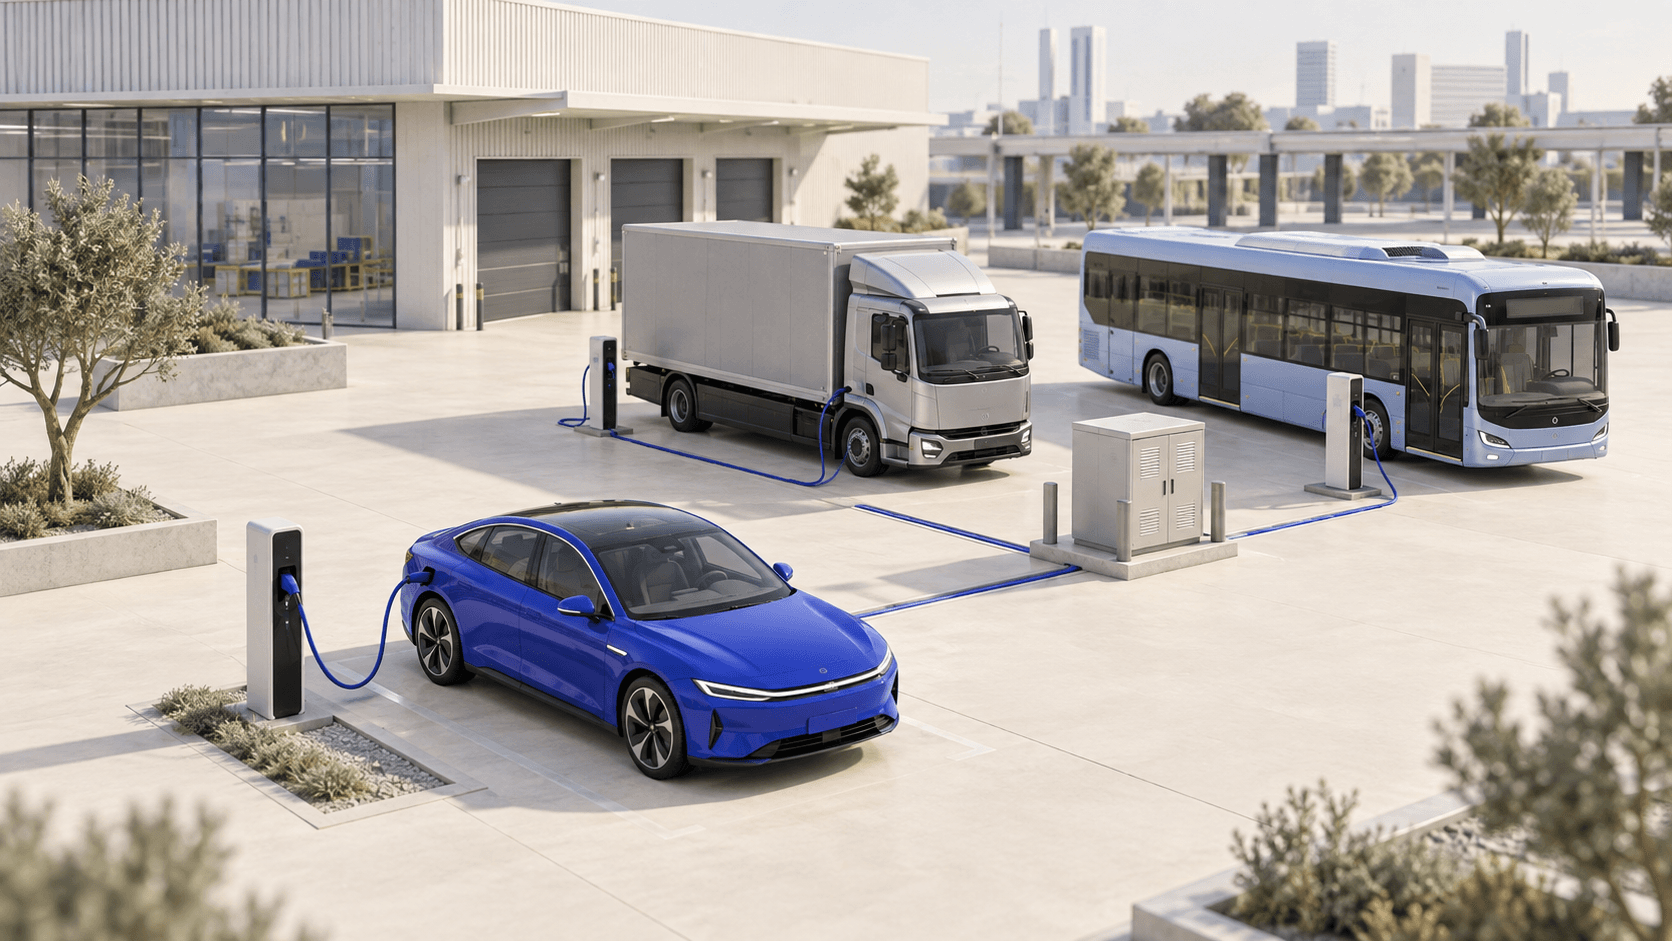
China is likely to remain the centre of electric vehicle production. Europe should electrify faster than North America. The manufacturers that succeed will have to combine competitive vehicles with charging, software, finance and dependable service.
That is my working view through 2030. It comes with an important distinction: a growing EV market does not guarantee a profitable EV manufacturer. Nor does a good car guarantee a viable business in every country.
The regional differences are already substantial. In 2025, electric cars accounted for almost 55% of new car sales in China, 28% in Europe and just under 10% in the United States. Globally, the figure was 25%. These are new sales, not the share of vehicles already on the road. Source: IEA, Global EV Outlook 2026.
Throughout this article, EV includes battery electric vehicles and plug-in hybrids. A plug-in hybrid still has a combustion engine. Conventional hybrids without a plug are excluded. That definition matters whenever someone claims the combustion engine is disappearing.
The latest IEA update expects EVs to reach 29% of global new-car sales in 2026. It also reports that worldwide electric car sales in the first half were slightly below the previous year, while their market share increased as the wider car market contracted. Adoption can advance even during a difficult year for manufacturers. Source: IEA, Electric Car Markets in a Time of Uncertainty.
Asia leads production, but Asia is several markets
China produced around 16 million electric cars in 2025, close to three-quarters of global output. The European Union produced nearly 3.2 million. That gap reflects an industrial system built around batteries, components, factories and a large domestic market. Source: IEA, manufacturing and trade.
My strongest conviction is that China retains its production and cost advantage through 2030. BYD and Geely are the clearest manufacturers to watch for scale, alongside Changan, Chery and SAIC. Tesla remains relevant. XPeng, Xiaomi, Li Auto, NIO and Leapmotor add competitive pressure, but I would not assume that every current challenger survives independently or earns attractive returns.
The rest of Asia needs a more local assessment. In India, my shortlist starts with Tata, Mahindra, Maruti Suzuki, Hyundai/Kia and JSW MG. In Southeast Asia, I would watch BYD, Geely, SAIC/MG and Chery alongside Hyundai/Kia, Japanese manufacturers and Vietnam's VinFast. Japan and Korea will retain substantial domestic-brand influence.
Those are prospective supplier lists, not a forecast ranking. Local prices, import rules, financing and service coverage will decide how much of the market each captures. Chinese engineering can reach a customer through an imported vehicle, a locally assembled car or a familiar brand with Chinese ownership. The badge alone tells an incomplete story.
There is also a warning in the export numbers. The latest IEA assessment identifies a gap of more than one million vehicles between Chinese EV exports and their recorded overseas sales over the preceding 18 months. Shipping delays explain part of that difference, but the IEA also points to inventory accumulation. Factory shipments should not be mistaken for final customer demand. Source: IEA, market update.
Europe will electrify faster than its manufacturers may prosper
Europe has a substantial manufacturing base and a strong commercial reason to keep it. Its established producers also face the difficult task of funding new electric platforms while managing combustion-engine businesses.
I expect Volkswagen Group, Renault and Stellantis to remain important in the volume market, with BMW and Mercedes-Benz in premium vehicles. Hyundai/Kia and Tesla should remain significant competitors. BYD, MG and Geely-owned brands should gain opportunities where they can pair competitive products with local distribution and support.
European EV adoption and European manufacturer profitability are separate outcomes. Faster adoption can coexist with falling prices, costly factory transitions and weaker returns for incumbents. Buyers benefit from competition before shareholders necessarily do.
For company fleets, leasing terms, residual values and reliable charging can be as important as the purchase price. For private buyers without home charging, convenience remains a different problem. Manufacturers need an answer for both customers.
North America takes a slower, uneven path
My base case is a longer period in which battery electric cars, plug-in hybrids, conventional hybrids and combustion vehicles sell alongside one another. Distance, vehicle size, local electricity prices, charging access and policy changes all affect the economics.
Tesla, GM and Hyundai/Kia are the manufacturers I would watch most closely for broad EV scale. Ford remains important, particularly where its commercial relationships help it sell a complete operating proposition. Rivian is a credible challenger, with execution and financing still central to the outcome. Toyota, Honda and European premium manufacturers remain relevant to the wider transition.
Canada should not be treated as a copy of the United States, and Mexico is both a consumer market and a manufacturing base. Trade arrangements can change the supplier mix much faster than a factory can be built.
Latin America deserves its own view. I expect Chinese manufacturers, particularly BYD and other competitive exporters, to gain ground alongside established local producers. Financing and local assembly will influence the pace. Applying a US adoption forecast to Brazil or Mexico would miss much of the opportunity.
My working forecast for 2030
These are judgement ranges for EVs as a share of new passenger-car sales. They are neither manufacturer production targets nor published IEA forecasts. They include plug-in hybrids and do not describe the existing vehicle fleet.
| Market | Working range for 2030 | Main condition |
|---|---|---|
| China | 75–85% | Affordable models and competitive battery supply continue to support adoption |
| Europe | 45–60% | Policy support, lower purchase prices and charging access keep improving |
| North America | 15–25% | More affordable vehicles offset uneven policy and infrastructure support |
Europe here means the wider regional market, not only the EU; North America includes the US, Canada and Mexico. These are broad planning assumptions, not the output of a country-by-country sales model. I have more confidence in China's manufacturing leadership than in the precise US adoption path. I would revise these ranges if policy, financing costs, charging availability or the relative cost of petrol and electricity changed materially.
Trucks and buses need a different forecast
Passenger-car brands do not provide a complete picture of commercial transport. Duty cycles matter. A city bus on a known route returning to a depot has a different charging problem from a truck crossing several countries.
Battery electric models already exceeded 55% of new city-bus sales in the EU in 2025. That figure should not be applied to all buses or long-distance coaches. Source: IEA, other EV modes.
For European trucks, my watchlist includes Daimler Truck, Volvo Group, Scania, MAN, DAF and Iveco. In North America, it includes Freightliner, Volvo/Mack, PACCAR and International, with Tesla as a challenger whose impact depends on execution at scale. In China, Sany, Sinotruk, FAW, Dongfeng, Foton and BYD deserve attention.
The bus list is different again: Yutong and BYD in China and export markets; Daimler Buses, MAN, Solaris, Iveco Bus and Volvo in Europe; and New Flyer, Gillig, Blue Bird, Thomas Built and IC Bus across North American transit and school-bus applications. These are manufacturers to assess by tender and use case, not predictions of equal market share.
I expect urban buses and predictable depot-based delivery routes to electrify faster than the hardest long-haul applications. A vehicle can have sufficient range on paper and still fail commercially if its charging schedule, payload or downtime does not fit the job.
The business extends beyond the vehicle
A fleet operator needs vehicles ready at the beginning of a shift. That requires the vehicle, depot connection, charging schedule, maintenance plan and financing contract to work together.
Software can help schedule charging against electricity prices, predict maintenance and assign vehicles to suitable routes. AI may improve those decisions, provided the system uses reliable operational data and leaves people accountable for safety and service. The commercial test is lower cost per kilometre and dependable availability.
There is evidence that value can sit outside vehicle manufacturing. Rivian's 2025 accounts reported a $432 million automotive gross loss and $576 million of gross profit in software and services. But that second category includes development work, remarketing, repairs and maintenance. Treating all of it as recurring software subscriptions would overstate the case. Gross profit is also not company net profit. Source: Rivian 2025 annual report.
For manufacturers, the practical choice is which capabilities to own and which to obtain through partners. For customers, the test is whether someone takes responsibility when those components fail to work together.
When assessing an EV business, I would therefore look beyond delivery growth: vehicle margins without temporary support, cash consumed to add capacity, customer retention, service coverage and the quality of recurring revenue. For a fleet contract, I would also want a clear answer on battery condition, residual-value risk, charging uptime and who pays when a vehicle misses a shift.
That is where I expect durable differentiation to develop as electric vehicles become more common.
Research and analysis as of 19 September 2026. Regional ranges and manufacturer watchlists are humAIne's working assessments; historical figures are attributed to their sources. Cover image: AI-generated editorial illustration.